
3.9 Scope Loop Verification
Recommended: After completing the Current Loop Auto Tune, verify the tuning results using CME’s built in Scope tool.
Complete all steps on this page before proceeding to the next topic.
On this page
Click the Scope icon in the CME toolbar.
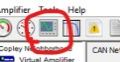
This tool allows you to record and visualize real time current, velocity, or position data from the amplifier, making it essential for validating the behavior of the motor after tuning.
2. Configure the Scope for Tuning Check
After completing the Current Loop Auto Tune, use the CME Scope tool to verify the current control and motor response are behaving correctly.
The Scope allows you to apply a test waveform to the axis and observe the response in real time.

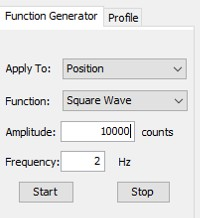
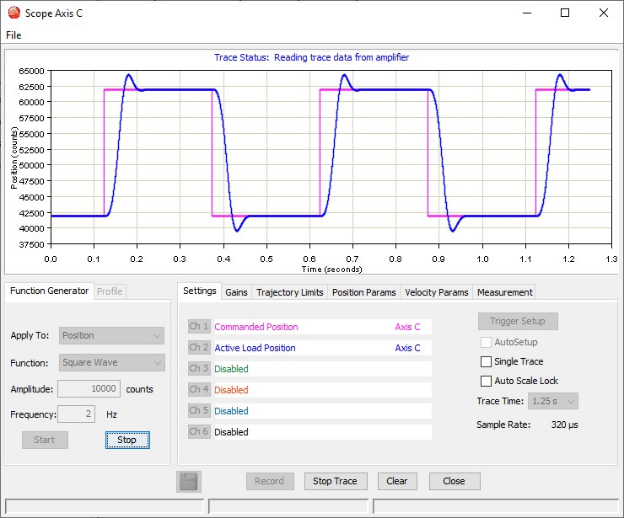
- Open Function Generator set up.
This controls the excitation signal used for tuning verification. - Set the following parameters:
- Apply To: Position
- Function: Square Wave
- Amplitude: e.g., 10000 counts (adjust for your stroke range)
- Frequency: e.g., 2 Hz
These settings command the motor to move back and forth, allowing you to observe how well the system follows the target.

3. Verify Measurement Channels (Center Section Settings Tab)
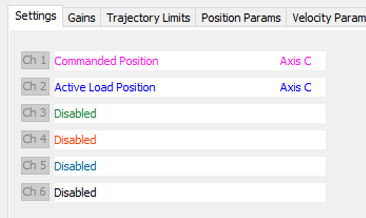
In the center of the screen, under the Settings tab, confirm the correct signals are assigned to the display channels:
- Ch 1: Commanded Position (Axis C)
- Ch 2: Active Load Position (Axis C)
- Remaining channels can stay Disabled
This ensures the Scope displays a clear comparison between:
- Pink = Commanded (target) motion
- Blue = Actual motion of the linear motor

Important: Before starting the Scope trace, verify that the selected amplitude is appropriate for the available travel range of the motor and mechanical system.
The example value shown in this guide is for demonstration purposes only.
- Verify the available stroke length.
- Confirm that the commanded travel distance will not exceed the mechanical limits.
- Ensure limit switches and emergency stop functions are operational.
- Keep clear of moving components during testing.
Improper amplitude settings may cause the axis to reach mechanical end stops and could result in equipment damage.
Once parameters are confirmed:
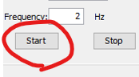
- Press Start in the Function Generator pane
- The motor begins moving according to the square‑wave pattern
- The Scope displays live waveform data as the motion occurs
As the trace runs, the system shows the real time feedback of the motor position relative to the commanded signal.

When the trace begins, the graph at the top of the window shows:
- Pink (Commanded Position): Sharp transitions from high to low
- Blue (Actual Position): Real motor motion following the command
A well tuned system should show:
- Minimal overshoot
- Minimal steady‑state error
- Smooth following motion
- No excessive oscillation or ringing
If the actual response deviates significantly, additional tuning (P Loop or V Loop) may be needed.
Continue to Velocity (V Loop) Tuning -->